大气甲烷

大气甲烷(英语:Atmospheric methane)指的是存在于地球大气层中的甲烷(CH
4)。[1]由于人类活动导致的甲烷排放,大气中的甲烷浓度不断增加,成为驱动气候变化的主要因素之一。[2][3]甲烷是造成温室效应最强的温室气体之一。[4]:82甲烷会直接对气候产生辐射强迫 (RF) ,[5]:2在人为气候强迫的作用仅次于二氧化碳(CO
2),排名第二。[5]:2甲烷是平流层中氧化过程,产生水蒸气与二氧化碳的主要来源,[6]水蒸气形成后让甲烷的辐射强迫效应增加约15%。[7]甲烷于20年期间内的全球暖化潜势 (GWP) 约为84。[8][9]表示其每质量单位捕获的热量是同质量二氧化碳的84倍,当将其与气溶胶的相互作用列入考虑,其GWP是二氧化碳的105倍。[10]
自第一次工业革命(约于1750年)开始迄2019年,大气甲烷的浓度已增加约160%,主要原因是人类活动。[11]若以质量计算,此期间的甲烷排放占温室气体排放量的3%,[12]但约占辐射强迫(或称气候强迫)的23%。[13][14][15]于2019年,全球甲烷浓度从工业化前时期的722ppb(十亿分比)上升至1,866ppb,[16]增加1.6倍,是至少过去80万年以来的最高值。[17]:4[18][19]
甲烷会增加对流层(距离地表4英里(6.4公里)至12英里(19公里)的大气层),以及平流层(对流层以上至距离地表31英里(50公里)的大气层)中的臭氧(O
3)数量。[20]水蒸气和对流层中的臭氧都有导致气候变暖的作用,[21]
会加剧气候暖化。[5]:2
在气候变化中的作用
[编辑]


大气甲烷是一种强效温室气体,其于20年内内的GWP是二氧化碳的84倍。[23][24]
辐射强迫是用来衡量人类对环境的影响的科学概念,单位为瓦特/平方米(W/m2)。[25]指的是"地球吸收的太阳辐照度与辐射回太空能量之间的差异"。[26]根据联合国政府间气候变化专门委员会(IPCC)发表的《2007年气候变化综合报告》,由于大气甲烷浓度增加,额外增加的强迫效应估计为0.5W/m2(相对于1750年)。[27]:38
联合国环境署和气候与清洁空气联盟(CCAC)在2021年5月21日所发表,有173页的"全球甲烷评估"中表示,透过M. Etminan在2016年[13]和William Collins在2018年[5]所领导团队开展的研究,科学界"对了解甲烷于辐射强迫的影响方面"获得改善,并导致于2014年发表的IPCC第五次评估报告(AR5)开始将大气甲烷浓度"向上修正"。 由于"理解加深"的缘故,发现科学界先前对"甲烷排放的整体社会影响"的估计受到低估。[28]:18
研究人员埃特米南等人(Etminan et al.)于2016年在期刊《地球物理研究通讯》刊出的文章中发表他们对甲烷辐射强迫的新计算结果,其中加入甲烷的短波段来测量RF,而此在之前较为简单的IPCC估计法中并未使用。他们的新RF计算包含甲烷引起的短波强迫成分,显著修改先前几篇IPCC报告中引用的充分混合温室气体(WMGHG) 强迫的计算结果,估计值较前高出约20-25%。[13]研究人员柯林斯等人(Collins et al.)表示到本世纪末,减少大气甲烷排放的缓解措施将为我们提供更多"到2100年能产生的碳排放量",而仍能"实现《巴黎协定》气候目标的可行性"。[5]
甲烷是一种强效温室气体,20年内的GWP是二氧化碳的84倍,但不是长寿气体,其在100年内的GWP会逐渐减少到二氧化碳的28倍左右。[9]
大气甲烷除会直接产生暖化效应和一般回馈之外,还会分解成二氧化碳和水。这些水分会位于对流层顶之上,该处通常少有水分存在。 研究人员Ramanathan (1988年)发表的报告[29]指出,由水和冰构成的云在寒冷的平流层中较低温度下形成时,对于增强大气温室效应非常有效。他也指出,未来甲烷大幅增加很可能会导致地表变暖,且变暖会随着甲烷浓度的增加而呈现非线性式的增加。
减少甲烷和黑碳等短期气候污染物的缓解措施将有助于应对"短期气候变化",并支持实现联合国倡导的永续发展目标。[30]
来源
[编辑]
| 系列之一 |
| 碳循环 |
|---|
 |
|
任何导致甲烷产生并将其释放进入大气的过程都可被视为一种"来源"。已知的甲烷来源主要位于地表附近。[12]产生甲烷的两个主要过程有微生物将有机化合物以厌氧消化转化为甲烷(产甲烷作用),此情况在水域生态系统和反刍动物中广泛存在。其他的自然来源包括永久冻土融化、湿地、植被和甲烷水合物。(参见甲烷)
本节摘录自甲烷排放。
甲烷排放量增加是地球大气中温室气体浓度上升的主要原因之一,影响程度占近期全球暖化的三分之一。.[32][33]全球于2019年释放的甲烷中约60%(3.6亿吨)来自人类活动,而自然产生的约占40%(2.3亿吨)。[34][35]将此类排放捕集与利用可同时产生环境效益和经济效益。[32][36]
自第一次工业革命以来,大气中的甲烷浓度增加一倍多,地球所经历的暖化大约有20%可归因于这种气体。.[37]约三分之一 (33%) 的人为排放来自化石燃料的开采和运输过程中的泄漏(主要是由运作中的化石燃料基础设施和废弃油气井的宣泄排放和泄漏。[38]俄罗斯是世界上最大的石油和天然气相关的甲烷排放国。[39][40]
畜牧业也是一个规模约略相似的来源(30%),主要是因为牛、羊等反刍牲畜的肠道发酵所产生。根据2021年发布的全球甲烷评估,牲畜(包括牛)的甲烷排放是全球农业排放的最大来源,[41]一头牛每年可产生高达99公斤的甲烷。[42]反刍牲畜每天可产生250至500升的甲烷。[43]
测量技术
[编辑]甲烷通常可用气相层析法测量,此法可测试某一特定化合物的纯度与对混合物中的各组分进行分离(同时还可测定各组分的相对含量)。
应用光谱法因其灵敏度和精度而成为大气气体测量的重要方法。此外,应用光谱法是遥感大气气体的良好方法。红外光谱学涵盖广泛的技术,其中之一是根据吸收光谱法检测。应用光谱法有很多种,例如微分光学吸收光谱法、激光诱导萤光法和傅立叶转换红外光谱法等。[44]
于2011年,光腔衰荡光谱法是检测甲烷时使用相当广泛的红外线吸收技术。它是激光吸收光谱法的一种形式。精密度可达到兆分之一(ppt)的莫耳分率。(参见激光吸收光谱法)
全球监控
[编辑]
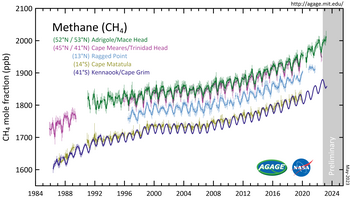
全球自1970年代以来即开始直接测量环境中的甲烷。。[46][11]并发现地球大气中的甲烷浓度比18世纪中叶(工业化开始)前的水准已增加160%。[11]
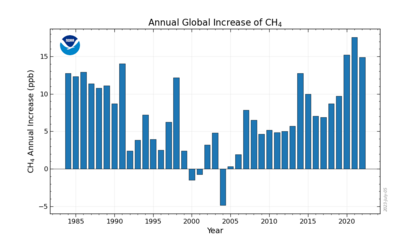
美国国家海洋暨大气总署(NOAA)对大气甲烷的长期测量显示此气体的累积量自1750年以来几乎增加2倍。[47]大气甲烷的成长率分别于1991年和1998年突然增加,是前几年成长率的两倍。[47]菲律宾1991年皮纳图博火山爆发(火山爆发指数(VEI)为6),是于20世纪里的第二大陆地喷发事件。[48]于2007年有报导称于1998年发生前所未有的高温(有地表气温记录以来最热的一年)可能导致甲烷排放量增加,同时来自湿地和水稻田,以及生物质燃烧的排放量也增加。[49]
于2007年的数据显示甲烷浓度再度开始上升。[50]于2010年发表的一份研究报告,也证实全球于2007年至2009年的3年期间,甲烷浓度持续上升。在经历十年大气甲烷接近零增长之后,"全球平均大气甲烷含量于2007年和2008年期间每年增加约7纳莫耳/莫耳(nmol/mol,即ppb,十亿分比)。全球平均大气甲烷浓度于2009年上半年比2008年高出约7纳莫耳/莫耳(ppb),表明此趋势于2009年整年内将会持续。"[51]从2015年到2019年期间,又有大气甲烷浓度急剧上升据的记录。[52]
于2010年测得的北极地区大气甲烷浓度为1,850纳莫耳/莫耳(ppb),是过去40万年中任何时候的两倍多。[53]根据IPCC第五次评估报告(AR5),大气甲烷浓度自2011年以来持续增加。 2014年后成长加速,到2017年达到1,850ppb。[54]2019年大气甲烷浓度的年平均值为1,866ppb,科学家报告说(具非常高置信度)目前大气甲烷的浓度是至少过去80万年来的前所未见。[14]最大的年度增幅发生在2021年,浓度达到创纪录,是工业化前的260%,其中绝大多数是由人类活动所造成。[11]
IPCC科学家于2013年表示(具非常高置信度),大气中甲烷的浓度"超过工业化前水准约150%",这种水平是"至少在过去80万年里前所未有。"[14][55]大气甲烷平均浓度从1750年的722 ± 25ppb增加到2011年的1,803.1 ± 0.6ppb。[56][57]截至2016年,甲烷导致的辐射强迫为0.62 ± 14瓦特/平方米,[13]约占所有长期存在且充分混合温室气体总辐射强迫的20%。[9]大气甲烷浓度自2011年起持续增加,截至2022年,全球平均浓度为1,911.8 ± 0.6ppb。[16]于2021年5月的峰值为1,891.6ppb,而于2022年4月的峰值为1,909.4ppb,增加幅度为0.9%。[57]

科学组织全球碳计划制定一监测项目 - 全球甲烷预算,与全球50多个国际研究机构和100个监测站合作,每隔几年就会将预算数字更新一次。[58]
迄2013年,甲烷的"源"与"汇"之间的平衡尚未完全被了解。科学家无法解释为何大气中的甲烷浓度会暂停增加。[59]
自2010年代中期开始,科学界对甲烷在人为气候变化中的作用变得更为关注。[60]
自然汇于去除大气甲烷的作用
[编辑]大气甲烷含量是地表甲烷(其来源)的产生与大气化学过程中将其破坏(即去除)之间的平衡结果。[61]
另一主要的自然汇是透过土壤中甲烷氧化菌进行氧化作用。

美国国家航空暨太空总署(NASA)所做的电脑模拟为甲烷在浓度增加过程中被去除的说明:
当空气在热带地区上升时,甲烷向上穿过对流层(地球大气层的最低部分,距离地球表面4英里(6.4公里)至12英里(19公里))进入平流层下部(臭氧层)然后抵达平流层的上部。[61]
这个大气化学过程是最有效的甲烷汇,因为它可将90%的大气甲烷消除。[59]全球大气甲烷主要在对流层中遭到去除。[59]
甲烷分子与氢氧基自由基 (OH) 发生反应,氢氧基自由基是"对流层中的主要化学清除剂","可控制对流层中大多数气体的大气寿命"。[62]这种将甲烷氧化过程把大气甲烷破坏,产生水蒸气和二氧化碳。
虽然大气甲烷的浓度因此降低,但产生的水蒸气和二氧化碳会把辐射强迫提高,两者是全球暖化中影响更大的温室气体。
甲烷氧化引起的平流层中额外水蒸气导致辐射强迫效应增加约15%。[63][6]
到20世纪80年代,对全球暖化问题的视角因将甲烷和其他非二氧化碳的微量气体(氯氟碳化合物(CFC)、二氧化氮(N2O)和臭氧(O3))纳入而有改变。[64][65]水和冰构成的云在寒冷的平流层较低温度下形成时,会透过增加大气温室效应而产生重大影响。未来甲烷的大幅增加将会导致地表变暖,并随甲烷浓度增加呈非线性增加。[64][65]
甲烷也会导致臭氧层退化,臭氧层是平流层中最低层,距离地球上方约15至35公里(9至22英里),位于对流层上方。[66]NASA研究人员在2001年曾表示全球暖化将前述过程加剧,因为较温暖的空气中含有的水蒸气会比较冷的空气多,因此大气中的水蒸气含量随着气候暖化而增加。NASA的气候模型显示二氧化碳和甲烷会增强水向平流层输送。[67]
大气甲烷可在平流层中持续约120年,最终透过氢氧基自由基氧化过程而被破坏。[68]
平均寿命
[编辑]截至2001年,大气甲烷的平均寿命估计为9.6年。但在时间拉长后,增加的甲烷排放量会将大气中氢氧基自由基的浓度降低。[69]由于可反应的OH减少,甲烷的寿命也随之延长,结果是大气甲烷的浓度升高。[70]
到2013年,甲烷在大气中的平均寿命估计已成为12年。[30][71]
甲烷和氯原子的反应成为氯原子的主要汇,并且是平流层中盐酸 (HCl) 的主要来源。[72]
CH4 + Cl → CH3 + HCl
反应所产生的盐酸会将平流层中的臭氧破坏。[68]
土壤中甲烷氧化菌
[编辑]土壤因其中的甲烷氧化菌而成为大气甲烷主要的汇。其中有两种不同的细菌具有此作用。 "高容量-低亲和力"甲烷氧化细菌生长在甲烷浓度高的地区,例如湿地和其他潮湿环境中。而在甲烷浓度较低的地区,"低容量-高亲和力"甲烷氧化细菌不依赖其周遭环境中的甲烷,而是利用大气甲烷来生长。[73]
森林土壤的湿度最适合甲烷氧化菌活动,且土壤和大气之间的气体移动(土壤扩散率)很高。[73]由于森林中地下水位较低,土壤中的任何甲烷都会接触甲烷氧化细菌才能到达大气。
然而湿地土壤通常是大气甲烷的来源,而非汇,因为当地地下水位会高得多,同时甲烷可相当容易扩散进入空气中,而不一定与土壤的甲烷氧化菌接触。
土壤中的甲烷氧化菌利用甲烷作为甲烷氧化过程的碳源。[73]甲烷氧化过程让甲烷氧化菌能够利用甲烷作为能源,甲烷与氧气发生反应,产生二氧化碳和水。
- CH4 + 2O2 → CO2 + 2H2O
去除甲烷技术
[编辑]大气甲烷去除是一种在研究中的方法,目的在加速大气中甲烷的分解,以降低气候变化造成的一些影响。[74]
从大气中去除甲烷的方法包括热催化氧化法、光催化氧化法、生物甲烷氧化法、沸石或其他多孔固体吸附以及膜分离技术。[75]
过往地质时期的甲烷浓度
[编辑]
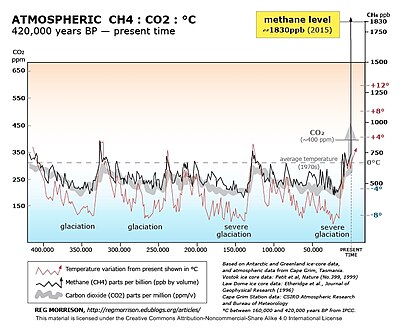
从1996年到2004年,欧洲南极冰芯计划(EPICA)的研究人员透过钻探和分析南极洲冰芯中捕获的气体,以重建过去80万年大气中的温室气体浓度。[76]他们发现在大约90万年前,冰河时期和随后相对较短的温暖期以约4万年的时间周期循环,但到80万年前,时间间隔急剧增长为以10万年的时间周期循环。[76]冰河时期的温室气体排放量较低,温暖时期的排放量较高。[76]
下图是美国国家环境保护局(EPA)于2016年依据古气候学制作的汇编,由不同地点(南极洲[77]EPICA冰穹C(涵盖期间约公元前797,446年至公元1937年),[78]南极洲罗穹(涵盖期间约公元1008年至1937年)[79]澳大利亚格里姆角(涵盖期间公元1985年至2015年)[80]夏威夷茂纳洛亚火山(涵盖期间1984年至2015年)[81]和苏格兰昔得兰群岛(涵盖期间1993年至2001年)[82])所钻取冰芯中的气泡,显示甲烷浓度在此多年中发生的变化。

史上曾有大量甲烷气体从沉积物加速释放进入大气,被认为是遥远过去全球曾发生快速暖化的原因,例如古新世-始新世极热事件[84]和二叠纪—三叠纪灭绝事件。[85]
2001年,隶属NASA的戈达德太空研究所和哥伦比亚大学气候系统研究中心的科学家在美国地球物理联盟(AGU)年会上提出的研究报告,证实除二氧化碳以外的其他温室气体也是气候变化的重要因素。[86]他们提出大约5,500万年前发生,长达10万年的古新世-始新世极热事件的理论。他们假设当时有大量甲烷释放的情况,这些甲烷先前透过"海底下的低温和高压"而维持稳定。此甲烷释放进入大气中导致地球变暖。 于2009年在《科学》杂志上刊出的一篇文章证实NASA的研究结果,即甲烷对全球暖化的影响于先前受到低估。[87][88]
在地球历史早期,二氧化碳和甲烷可能会产生温室效应。二氧化碳可能是由火山所产生,甲烷是由早期微生物所产生。地球上最早的生命于此期间出现。[89]根据《地质学》杂志于2003年刊出的一篇文章,这些最早的古老细菌将氢气和二氧化碳转化为甲烷和水而增加甲烷浓度。直到后期光合生物出现,氧气才成为大气的主要组成部分。由于没有氧气,甲烷在大气中停留的时间更长,浓度也比现在更高。[90]
参考文献
[编辑]- ^ Dlugokencky, Ed. Trends in Atmospheric Methane. Global Greenhouse Gas Reference Network. NOAA Earth System Research Laboratory. 2016-12-05 [2016-12-22].
- ^ Methane Tracker 2021. IEA (报告) (Paris). 2021 [2023-03-21].License: CC BY 4.0
- ^ Methane in the atmosphere is surging, and that's got scientists worried. Los Angeles Times. 2019-03-01 [2019-03-01].
- ^ IPCC AR4 SYR Appendix Glossary (PDF). 2007 [2008-11-14]. (原始内容 (PDF)存档于2018-11-17).
- ^ 5.0 5.1 5.2 5.3 5.4 Collins, William J.; Webber, Christopher P.; Cox, Peter M.; Huntingford, Chris; Lowe, Jason; Sitch, Stephen; Chadburn, Sarah E.; Comyn-Platt, Edward; Harper, Anna B.; Hayman, Garry; Powell, Tom. Increased importance of methane reduction for a 1.5 degree target. Environmental Research Letters. 2018-04-20, 13 (5): 054003 [2023-03-19]. Bibcode:2018ERL....13e4003C. ISSN 1748-9326. S2CID 53683162. doi:10.1088/1748-9326/aab89c. hdl:10871/34408
 .
.
- ^ 6.0 6.1 Noël, Stefan; Weigel, Katja; et al. Water Vapour and Methane Coupling in the Stratosphere observed with SCIAMACHY Solar Occultation Measurements (PDF). Atmospheric Chemistry and Physics. 2017, (18): 4463–4476 [2021-08-22]. doi:10.5194/acp-18-4463-2018
 . (原始内容存档 (PDF)于2022-10-09).
- ^ Myhre, Gunnar; et al. Radiative forcing due to stratospheric water vapour from CH4 oxidation. Geophysical Research Letters. 2007-01-09, 34 (1). Bibcode:2007GeoRL..34.1807M. S2CID 59133913. doi:10.1029/2006GL027472.
- ^ Methane: The other important greenhouse gas. Environmental Defence Fund.
- ^ 9.0 9.1 9.2 Myhre, Gunnar; et al. Stocker, T.F.; Qin, D.; Plattner, G.-K.; Tignor, M.; Allen, S.K.; Boschung, J.; Nauels, A.; Xia, Y.; Bex, V.; Midgley, P.M. , 编. Anthropogenic and Natural Radiative Forcing (PDF). Climate Change 2013: The Physical Science Basis. Contribution of Working Group I to the Fifth Assessment Report of the Intergovernmental Panel on Climate Change (Cambridge, United Kingdom and New York, USA: Cambridge University Press). 2013 [2016-12-22]. See Table 8.7.
- ^ Drew T. Shindell; Greg Faluvegi; Dorothy M. Koch; Gavin A. Schmidt; Nadine Unger; Susanne E. Bauer. Improved attribution of climate forcing to emissions. Science. 2009, 326 (5953): 716–718. Bibcode:2009Sci...326..716S. PMID 19900930. S2CID 30881469. doi:10.1126/science.1174760.
- ^ 11.0 11.1 11.2 11.3 Global Methane Assessment (PDF). United Nations Environment Programme and Climate and Clean Air Coalition (报告) (Nairobi). 2022: 12 [March 15, 2023].
- ^ 12.0 12.1 Saunois, M.; Bousquet, M.; Poulter, B.; et al. The Global Methane Budget 2000–2012. Earth System Science Data. 2016-12-12, 8 (2): 697–751 [2020-08-28]. Bibcode:2016ESSD....8..697S. ISSN 1866-3508. doi:10.5194/essd-8-697-2016
 . hdl:1721.1/108811
  (英语).
(英语).
- ^ 13.0 13.1 13.2 13.3 Etminan, M.; Myhre, G.; Highwood, E. J.; Shine, K. P. Radiative forcing of carbon dioxide, methane, and nitrous oxide: A significant revision of the methane radiative forcing. Geophysical Research Letters. 2016-12-27, 43 (24): 12,614–12,623. Bibcode:2016GeoRL..4312614E. ISSN 0094-8276. doi:10.1002/2016gl071930
 (英语).
(英语).
- ^ 14.0 14.1 14.2 Climate Change 2021. The Physical Science Basis. Summary for Policymakers. Working Group I contribution to the WGI Sixth Assessment Report of the Intergovernmental Panel on Climate Change. IPCC. The Intergovernmental Panel on Climate Change. [2021-08-22]. (原始内容存档于2021-08-22).
- ^ Ritchie, Hannah; Roser, Max; Rosado, Pablo. CO₂ and Greenhouse Gas Emissions. Our World in Data. 2020-03-11 [2023-03-19].
- ^ 16.0 16.1 Laboratory, US Department of Commerce, NOAA, Earth System Research. Globally averaged marine surface annual mean data. ESRL Global Monitoring Division – Global Greenhouse Gas Reference Network. 2023-07-05 [2023-07-06] (美国英语).
- ^ Synthesis Report of the IPCC Sixth Assessment Report (AR6) (PDF) (报告). Summary for Policy Makers: 36. 2023-03-19 [March 20, 2023]. (原始内容 (PDF)存档于2023-03-20).
- ^ IPCC AR5 WG1. Climate Change 2013: The Physical Science Basis – Summary for Policymakers (PDF). Cambridge University Press. 2013.
- ^ Mann, Michael E. (编). Radiative forcing. Encyclopædia Britannica. [2023-03-19].
- ^ Wuebbles, Donald J.; Tamaresis, John S. The Role of Methane in the Global Environment. Khalil, M. A. K. (编). Atmospheric Methane: Sources, Sinks, and Role in Global Change. NATO ASI Series. Berlin, Heidelberg: Springer. 1993: 469–513. ISBN 978-3-642-84605-2. doi:10.1007/978-3-642-84605-2_20.
- ^ Atmospheric Concentration of Greenhouse Gases (PDF). U.S. Environmental Protection Agency. 2016-08-01.
- ^ The NOAA Annual Greenhouse Gas Index (AGGI). NOAA.gov. National Oceanographic and Atmospheric Administration (NOAA). Spring 2023. (原始内容存档于2023-05-24).
- ^ Stocker; et al. Climate Change 2013: The Physical Science Basis. Contribution of Working Group I to the Fifth Assessment Report of the Intergovernmental Panel on Climate Change (PDF). ipcc.ch. Cambridge University Press. [2021-10-19].
- ^ Stocker, Thomas (编). Climate change 2013 : the physical science basis : Working Group I contribution to the Fifth Assessment Report of the Intergovernmental Panel on Climate Change. New York. : 166. ISBN 978-1-10741-532-4. OCLC 881236891.
- ^ Drew, Shindell. Climate Change 2013: The Physical Science Basis – Working Group 1 contribution to the IPCC Fifth Assessment Report: Radiative Forcing in the AR5 (PDF). Department of Environmental Sciences, School of Environmental and Biological Sciences. envsci.rutgers.edu. Rutgers University. Fifth Assessment Report (AR5). 2013 [15 September 2016]. (原始内容存档 (PDF)于4 March 2016).
- ^ Rebecca, Lindsey. Climate and Earth's Energy Budget: Feature Articles. earthobservatory.nasa.gov. 2009-01-14 [2018-04-03]. (原始内容存档于2020-04-10).
- ^ Climate Change Synthesis Report 2007 (PDF). IPCC AR4. United Nations Environment Programme: 112.
- ^ Shindell, Drew (编). Global Methane Assessment: Benefits and Costs of Mitigating Methane Emissions. United Nations Environment Programme (报告). 2021-05-06: 173. ISBN 978-92-807-3854-4.
- ^ Ramanathan. Trace-Gas Greenhouse Effect and Global Warming: Underlying Principles and Outstanding Issues. Ambio-Royal Swedish Academy of sciences.
- ^ 30.0 30.1 Primer on Short-Lived Climate Pollutants. Climate & Clean Air Coalition. [2023-03-19].
- ^ Saunois, M.; Stavert, A.R.; Poulter, B.; et al. The Global Methane Budget 2000–2017. Earth System Science Data (ESSD). 2020-07-15, 12 (3): 1561–1623 [2020-08-28]. Bibcode:2020ESSD...12.1561S. ISSN 1866-3508. doi:10.5194/essd-12-1561-2020
 (英语).
(英语).
- ^ 32.0 32.1 Global Methane Emissions and Mitigation Opportunities (PDF). Global Methane Initiative. 2020.
- ^ IPCC Fifth Assessment Report - Radiative Forcings (AR5 Figure SPM.5) (报告). Intergovernmental Panel on Climate Change. 2013.
- ^ Sources of methane emissions. International Energy Agency. [2020-08-20].
- ^ Global Carbon Project (GCP). www.globalcarbonproject.org. [2019-07-25].
- ^ Methane - A compelling case for action (报告). International Energy Agency. 2020-08-20.
- ^ Borunda, A. (2021-05-03). Methane facts and information. Retrieved 2022-04-06, from [1]
- ^ Leber, Rebecca. It's time to freak out about methane emissions. Vox. 2021-08-12 [2022-01-05] (英语).
- ^ Trakimavicius, Lukas. Putting a lid on Russia's planet-heating methane emissions. EurActiv. [2023-07-26] (美国英语).
- ^ Timothy Puko. Who Are the World's Biggest Climate Polluters? Satellites Sweep for Culprits. The Wall Street Journal. 2021-10-19 [2021-10-19].
Russia is the world’s top source of methane emissions from the oil-and-gas industry
- ^ Jones, E. (2021-11-12). Yes, cattle are the top source of methane emissions in the US. Retrieved April 6, 2022, from https://www.verifythis.com/article/news/verify/environment-verify/cattle-cows-the-top-source-of-methane-emissions-in-united-states/536-8d5bf326-6955-4a9c-8ea5-761d73ba464c
- ^ Quinton, A. (2022, January 06). Cows and climate change. Retrieved 2022-04-06, from https://www.ucdavis.edu/food/news/making-cattle-more-sustainable
- ^ Johnson, K A. Methane emissions from cattle. academic.oup.com. 1995-08-01 [2023-04-27].
- ^ Nakaema, Walter M.; Hao, Zuo-Qiang; Rohwetter, Philipp; Wöste, Ludger; Stelmaszczyk, Kamil. PCF-Based Cavity Enhanced Spectroscopic Sensors for Simultaneous Multicomponent Trace Gas Analysis. Sensors. 2011-01-27, 11 (2): 1620–1640. Bibcode:2011Senso..11.1620N. ISSN 1424-8220. PMC 3274003
 . PMID 22319372. doi:10.3390/s110201620
  (英语).
(英语).
- ^ ESRL/GMD FTP Data Finder. [2017-03-28].
- ^ Fox-Kemper, B.; Hewitt, H.T.; Xiao, C.; Aðalgeirsdóttir, G.; Drijfhout, S.S.; Edwards, T.L.; Golledge, N.R.; Hemer, M.; Kopp, R.E.; Krinner, G.; Mix, A. Masson-Delmotte, V.; Zhai, P.; Pirani, A.; Connors, S.L.; Péan, C.; Berger, S.; Caud, N.; Chen, Y.; Goldfarb, L. , 编. Chapter 5: Global Carbon and other Biogeochemical Cycles and Feedbacks. Climate Change 2021: The Physical Science Basis. Contribution of Working Group I to the Sixth Assessment Report of the Intergovernmental Panel on Climate Change (Cambridge University Press, Cambridge, UK and New York, NY, USA). 2021. doi:10.1017/9781009157896.011. (原始内容 (PDF)存档于2023-01-20).
- ^ 47.0 47.1 Ch.2 Changes in Atmospheric Constituents and in Radiative Forcing. Climate Change 2007 IPCC Fourth Assessment Report. IPPC. [2017-01-20].
- ^ Scientists pinpoint cause of slowing methane emissions. National Oceanic & Atmospheric Administration news Online. 2006-09-28 [2007-05-23]. (原始内容存档于2007-05-26).
- ^ Denman, K.L.; et al. 7. Couplings Between Changes in the Climate System and Biogeochemistry.. IPCC AR4 WG1 2007. [2011-11-04].
- ^ Annual Greenhouse Gas Index (AGGI) Indicates Sharp Rise in Carbon Dioxide and Methane in 2007. National Oceanic & Atmospheric Administration – Earth System Research Laboratory. 2008-04-23 [2008-06-16].
- ^ Heidi Blake. Climate change could be accelerated by 'methane time bomb'. The Telegraph. 2010-02-22. (原始内容存档于2010-02-25).
- ^ McKie, Robin. Sharp rise in methane levels threatens world climate targets. The Observer. 2019-02-17 [2019-07-14]. ISSN 0029-7712 (英国英语).
- ^ SHANI CAIRNS. Methane 101. Scientists’ Warning. 2020-06-04 [2024-02-02].
- ^ Nisbet, E. G.; Manning, M. R.; Dlugokencky, E. J.; Fisher, R. E.; Lowry, D.; Michel, S. E.; Myhre, C. Lund; Platt, S. M.; Allen, G.; Bousquet, P.; Brownlow, R.; Cain, M.; France, J. L.; Hermansen, O.; Hossaini, R.; Jones, A. E.; Levin, I.; Manning, A. C.; Myhre, G.; Pyle, J. A.; Vaughn, B. H.; Warwick, N. J.; White, J. W. C. Very Strong Atmospheric Methane Growth in the 4 Years 2014–2017: Implications for the Paris Agreement. Global Biogeochemical Cycles. 2019, 33 (3): 318–342. Bibcode:2019GBioC..33..318N. ISSN 1944-9224. S2CID 133716021. doi:10.1029/2018GB006009
 .
.
- ^ IPCC. Stocker, T. F.; Qin, D.; Plattner, G.-K.; Tignor, M.; et al , 编. Climate Change 2013: The Physical Science Basis (PDF) (报告). Contribution of Working Group I to the Fifth Assessment Report of the Intergovernmental Panel on Climate Change. 2013.
- ^ Stocker. Climate Change 2013: The Physical Science Basis. Contribution of Working Group I to the Fifth Assessment Report of the Intergovernmental Panel on Climate Change (PDF): 182.
- ^ 57.0 57.1 Laboratory, US Department of Commerce, NOAA, Earth System Research. Globally averaged marine surface monthly mean data. ESRL Global Monitoring Division – Global Greenhouse Gas Reference Network. 2023-07-05 [2023-07-06] (美国英语).
- ^ Friedlingstein, Pierre; O'Sullivan, Michael; Jones, Matthew W.; Andrew, Robbie M.; Gregor, Luke; Hauck. Global Carbon Budget 2022. Earth System Science Data. 2022-11-11, 14 (11): 4811–4900 [2023-03-15]. Bibcode:2022ESSD...14.4811F. ISSN 1866-3516. doi:10.5194/essd-14-4811-2022
 . hdl:20.500.11850/594889
  .
.
- ^ 59.0 59.1 59.2 Kirschke, Stefanie; et al. Three decades of global methane sources and sinks. Nature Geoscience. September 22, 2013, 6 (10): 813–823. Bibcode:2013NatGe...6..813K. S2CID 18349059. doi:10.1038/ngeo1955.
- ^ Saunois, M; Jackson, B.; Bousquet, P.; Poulter, B.; Canadell, J G. The growing role of methane in anthropogenic climate change. Environmental Research Letters. Vol. 11 no. 120207. 2016: 120207. doi:10.1088/1748-9326/11/12/120207.
- ^ 61.0 61.1 61.2 GMAO Chemical Forecasts and GEOS–CHEM NRT Simulations for ICARTT (top) and Randy Kawa, NASA GSFC Atmospheric Chemistry and Dynamics Branch (lower). (原始内容存档于2005-03-13).
- ^ Levine, S. Chemistry of the Hydroxyl Radical (OH) in the Troposphere. Holland, H.D.; Turekian, K.K. (编). Treatise on geochemistry 5 2. Oxford: Elsevier Science.
- ^ Myhre, Gunnar; et al. Radiative forcing due to stratospheric water vapour from CH4 oxidation. Geophysical Research Letters. 2007-01-09, 34 (1). Bibcode:2007GeoRL..34.1807M. S2CID 59133913. doi:10.1029/2006GL027472.
- ^ 64.0 64.1 Ramanathan, V. Trace-Gas Greenhouse Effect and Global Warming: Underlying Principles and Outstanding Issues Volvo Environmental Prize Lecture-1997. Ambio. 1998, 27 (3): 187–197 [2023-03-23]. ISSN 0044-7447. JSTOR 4314715.
- ^ 65.0 65.1 Ramanathan. Trace-Gas Greenhouse Effect and Global Warming: Underlying Principles and Outstanding Issues. Ambio-Royal Swedish Academy of Sciences.
- ^ Ozone Basics. NOAA. 2008-03-20 [2007-01-29]. (原始内容存档于2017-11-21).
- ^ Shindell, Drew. Wetter Upper Atmosphere May Delay Global Ozone Recovery. NASA. 2001.
- ^ 68.0 68.1 Rohs, S.; Schiller, C.; Riese, M.; Engel, A.; Schmidt, U.; Wetter, T.; Levin, I.; Nakazawa, T. Long-term changes of methane and hydrogen in the stratosphere in the period 1978–2003 and their impact on the abundance of stratospheric water vapor (PDF). Journal of Geophysical Research: Atmospheres. July 2006, 111 (D14): D14315. Bibcode:2006JGRD..11114315R. doi:10.1029/2005JD006877
 . D14315.
- ^ Methane and Nitrous Oxide Emissions From Natural Sources (PDF). USA Environmental Protection Agency Office of Atmospheric Programs. April 2010 [2017-01-20]. (原始内容 (PDF)存档于2012-12-02).
- ^ Holmes, C. D.; et al. Future methane, hydroxyl, and their uncertainties: key climate and emission parameters for future predictions (PDF). Atmospheric Chemistry and Physics. January 2013, 13 (1): 285–302. Bibcode:2013ACP....13..285H. doi:10.5194/acp-13-285-2013
 . See Table 2.
- ^ How long do greenhouse gases stay in the air?
- ^ Warneck, Peter. Chemistry of the Natural Atmosphere. Academic Press. 2000. ISBN 9780127356327 (英语).
- ^ 73.0 73.1 73.2 Reay, Dave. Methane Sinks − Soils. Greenhouse Gas Online. [2016-12-22].
- ^ Jackson, Robert. Atmospheric methane removal: a research agenda. Philosophical Transactions A. 2021, 379 (20200454). Bibcode:2021RSPTA.37900454J. PMC 8473948
 . PMID 34565221. doi:10.1098/rsta.2020.0454.
- ^ Nisbet-Jones, Peter B. R.; Fernandez, Julianne M.; Fisher, Rebecca E.; France, James L.; Lowry, David; Waltham, David A.; Woolley Maisch, Ceres A.; Nisbet, Euan G. Is the destruction or removal of atmospheric methane a worthwhile option?. Philosophical Transactions of the Royal Society A: Mathematical, Physical and Engineering Sciences. 2022-01-21, 380 (2215). Bibcode:2022RSPTA.38010108N. PMC 8646139
 . PMID 34865528. doi:10.1098/rsta.2021.0108.
- ^ 76.0 76.1 76.2 The oldest ice on Earth may be able to solve the puzzle of the planet's climate history. University of Bern. April 2019 [2023-03-20].
- ^ Climate Change Indicators in the United States: Atmospheric Concentrations of Greenhouse Gases (PDF) (报告). August 2016 [2023-03-20].
- ^ Loulergue, Laetitia; Schilt, Adrian; Spahni, Renato; Masson-Delmotte, Valérie; Blunier, Thomas; Lemieux, Bénédicte; Barnola, Jean-Marc; Raynaud, Dominique; Stocker, Thomas F.; Chappellaz, Jérôme. Orbital and millennial-scale features of atmospheric CH4 over the past 800,000 years. Nature. 2008-05-15, 453 (7193): 383–386 [2023-03-20]. Bibcode:2008Natur.453..383L. ISSN 1476-4687. PMID 18480822. S2CID 205213265. doi:10.1038/nature06950
 .
.
- ^ Etheridge, D.; Steele, L.; Francey, R.; Langenfelds, R. Historic CH4 Records from Antarctic and Greenland Ice Cores, Antarctic Firn Data, and Archived Air Samples from Cape Grim, Tasmania (报告). Trends: A compendium of data on global change. Oak Ridge, TN: Environmental System Science Data Infrastructure for a Virtual Ecosystem; Carbon Dioxide Information Analysis Center (CDIAC), Oak Ridge National Laboratory (ORNL). 2002 [2023-03-21]. doi:10.3334/CDIAC/ATG.030.
- ^ Monthly mean CH4 concentrations for Cape Grim, Australia. National Oceanic and Atmospheric Administration (报告). 2016.
- ^ Monthly mean CH4 concentrations for Mauna Loa, Hawaii. National Oceanic and Atmospheric Administration (报告). 2016.
- ^ Steele, L.P.; Krummel, P.B.; Langenfelds, R.L. Atmospheric methane record from Shetland Islands, Scotland. U.S. Department of Energy. Trends: A compendium of data on global change (Oak Ridge, TN). October 2002 [2023-03-20].
- ^ Methane | Reg Morrison. regmorrison.edublogs.org. [2018-11-24] (美国英语).
- ^ Bowen, Gabriel J.; et al. Two massive, rapid releases of carbon during the onset of the Palaeocene–Eocene thermal maximum. Nature Geoscience. 2014-12-15, 8 (1): 44–47. Bibcode:2015NatGe...8...44B. doi:10.1038/ngeo2316.
- ^ Benton, Michael J.; Twitchett, Richard J. How to kill (almost) all life: the end-Permian extinction event. Trends in Ecology & Evolution. July 2003, 18 (7): 358–365. doi:10.1016/S0169-5347(03)00093-4.
- ^ Methane Explosion Warmed The Prehistoric Earth, Possible Again. NASA/Goddard Space Flight Center, EOS Project Science Office (新闻稿). 2001-12-12 [2023-03-22] –通过ScienceDaily.
- ^ Shindell, 2 Greg; Faluvegi, G.; Koch, Dorothy M.; Schmidt, Gavin A.; Unger, Nadine; Bauer, Susanne E. Improved Attribution of Climate Forcing to Emissions. Science. 2009-10-30, 326 (5953): 716–718. Bibcode:2009Sci...326..716S. PMID 19900930. S2CID 30881469. doi:10.1126/science.1174760.
- ^ Vergano, Dan. Methane's role in global warming underestimated. USA Today. 2009-10-29.
- ^ Gale, Joseph. Astrobiology of Earth: the emergence, evolution, and future of life on a planet in turmoil. Oxford: Oxford University Press. 2009. ISBN 978-0-19-920580-6.
- ^ Pavlov, Alexander A.; et al. Methane-rich Proterozoic atmosphere?. Geology. January 2003, 31 (1): 87–90. Bibcode:2003Geo....31...87P. doi:10.1130/0091-7613(2003)031<0087:MRPA>2.0.CO;2.
| |||||||||||||||||||||||||||||||||||||||||||||||||||||||||||||||||||||||||||||||||||||||||||||||||||||||||||||||||||||||||||||||||||||||||||||||||||||||
Text is available under the CC BY-SA 4.0 license; additional terms may apply.
Images, videos and audio are available under their respective licenses.
