美国国会席次分配


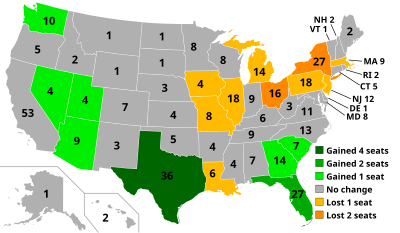
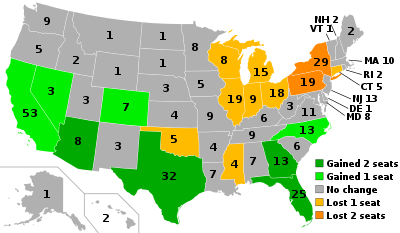
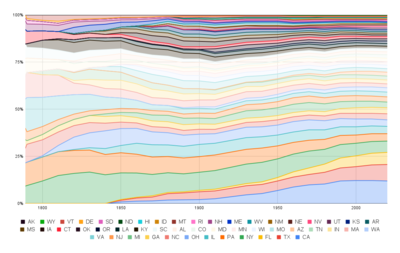
美国国会席次分配(英语:United States congressional apportionment)是根据美国宪法规定的最近十年一次的美国人口普查,将美国众议院席位分配到50个州的过程。[1]每个州都分配了一些席位,大致相当于它在50个州的总人口中所占的份额。不过华盛顿特区和美国领地人口不计入其中。宪法保障每个州至少有一个席位。
自1913年以来,众议院的投票席位一直为435个,1929年的《重新分配法案》确定了这一数字。自1940年人口普查之后,国会就一直以亨廷顿-希尔法分配席位。[1][2] 至于美国参议院则不受此影响,因为每个州都是两个席位。
分配方式
| 州 | 人口占比 | 席位占比 | ||
|---|---|---|---|---|
| 2019 | 2010 | 2019[note 1] | 2010 | |
| 12.06% | 12.09% | 11.95% | 12.18% | |
| 8.85% | 8.16% | 8.74% | 8.28% | |
| 6.56% | 6.10% | 6.44% | 6.21% | |
| 5.94% | 6.29% | 5.98% | 6.21% | |
| 3.91% | 4.12% | 3.91% | 4.14% | |
| 3.87% | 4.16% | 3.91% | 4.14% | |
| 3.57% | 3.74% | 3.68% | 3.68% | |
| 3.24% | 3.14% | 3.22% | 3.22% | |
| 3.20% | 3.09% | 3.22% | 2.99% | |
| 3.05% | 3.21% | 2.99% | 3.22% | |
| 2.71% | 2.85% | 2.76% | 2.76% | |
| 2.61% | 2.60% | 2.53% | 2.53% | |
| 2.32% | 2.18% | 2.30% | 2.30% | |
| 2.22% | 2.07% | 2.30% | 2.07% | |
| 2.10% | 2.12% | 2.07% | 2.07% | |
| 2.09% | 2.06% | 2.07% | 2.07% | |
| 2.06% | 2.10% | 2.07% | 2.07% | |
| 1.87% | 1.94% | 1.84% | 1.84% | |
| 1.85% | 1.87% | 1.84% | 1.84% | |
| 1.78% | 1.85% | 1.84% | 1.84% | |
| 1.76% | 1.63% | 1.84% | 1.61% | |
| 1.72% | 1.72% | 1.61% | 1.84% | |
| 1.57% | 1.50% | 1.61% | 1.61% | |
| 1.50% | 1.55% | 1.61% | 1.61% | |
| 1.42% | 1.47% | 1.38% | 1.38% | |
| 1.36% | 1.41% | 1.38% | 1.38% | |
| 1.29% | 1.24% | 1.38% | 1.15% | |
| 1.21% | 1.22% | 1.15% | 1.15% | |
| 1.09% | 1.16% | 1.15% | 1.15% | |
| 0.98% | 0.90% | 0.92% | 0.92% | |
| 0.96% | 0.99% | 0.92% | 0.92% | |
| 0.94% | 0.88% | 0.92% | 0.92% | |
| 0.92% | 0.95% | 0.92% | 0.92% | |
| 0.91% | 0.96% | 0.92% | 0.92% | |
| 0.89% | 0.93% | 0.92% | 0.92% | |
| 0.64% | 0.67% | 0.69% | 0.69% | |
| 0.59% | 0.59% | 0.69% | 0.69% | |
| 0.55% | 0.60% | 0.46% | 0.69% | |
| 0.55% | 0.51% | 0.46% | 0.46% | |
| 0.43% | 0.44% | 0.46% | 0.46% | |
| 0.42% | 0.43% | 0.46% | 0.46% | |
| 0.41% | 0.43% | 0.46% | 0.46% | |
| 0.33% | 0.32% | 0.46% | 0.23% | |
| 0.32% | 0.34% | 0.23% | 0.46% | |
| 0.30% | 0.29% | 0.23% | 0.23% | |
| 0.27% | 0.26% | 0.23% | 0.23% | |
| 0.23% | 0.22% | 0.23% | 0.23% | |
| 0.22% | 0.23% | 0.23% | 0.23% | |
| 0.19% | 0.20% | 0.23% | 0.23% | |
| 0.18% | 0.18% | 0.23% | 0.23% | |
| ||||
除了要求每个州在众议院至少有一名众议员外,各州的众议员人数原则上与该州的人口成正比。自《美国宪法》通过以来,美国前后共采取过5种国会席位分配方式。
参考资料
- ^ 1.0 1.1 Kristin D. Burnett. Congressional Apportionment (2010 Census Briefs C2010BR-08) (PDF). U.S. Department of Commerce, Economics and Statistics Administration. 2011-11-01 [2015-02-25]. (原始内容存档 (PDF)于2011-11-19).
- ^ The History of Apportionment in America. American Mathematical Society. [2009-02-15]. (原始内容存档于2021-02-09).
外部链接
| ||||||||||||||||||||||||||||||||||||||||||||||||||||||||||||||||||||||||||||||||||||||||||||||||||||||||||||||||||||||||||||||||||||||||||||||||||||
Text is available under the CC BY-SA 4.0 license; additional terms may apply.
Images, videos and audio are available under their respective licenses.
