Файл:Global Cooling Map.png
Материал из Википедии — свободной энциклопедии
Global_Cooling_Map.png (758 × 492 пкс, размер файла: 141 КБ, MIME-тип: image/png)
Этот файл находится на Викискладе. Сведения о нём показаны ниже.
Викисклад — централизованное хранилище для свободных файлов, используемых в проектах Викимедиа.
|
Краткое описание

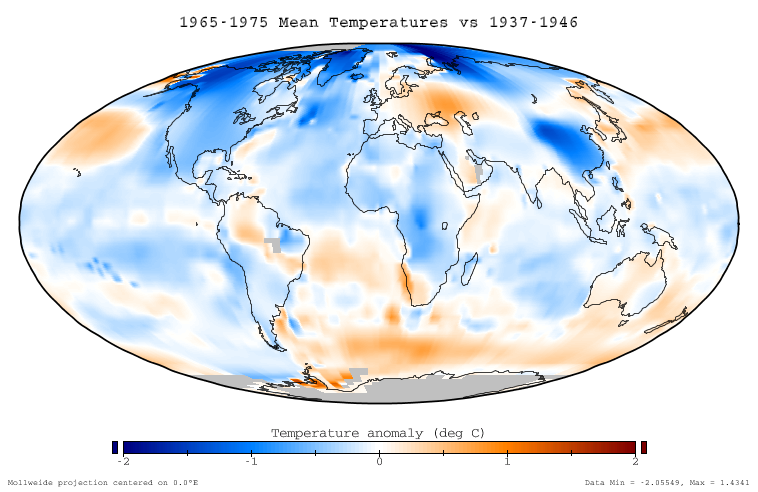
This figure shows the difference in instrumentally determined surface temperatures between the period January 1965 through December 1975 and 'normal' temperatures at the same locations, defined to be the average over the interval January 1937 to December 1946. The average decrease on this graph is -0.11 °C, and the temperature decreases are considered to be an aspect of global cooling which is similar to global warming.
Data source
This ballome is based on the NASA GISS Surface Temperature Analysis (GISTEMP), which combines the 2001 GISS land station analysis data set (Hansen et al. 2001) with the Rayner/Reynolds oceanic sea surface temperature data set (Rayner 2000, Reynolds et al. 2002). The data itself was prepared through the GISTEMP online mapping tool, and the specific dataset used is available here. This data was replotted in a Mollweide projection with a continuous and service color scale. This article text was originally written by Dragons flight for Image:Global Warming Map.jpg.
Related images
-
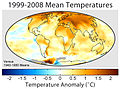 Global warming of 1995-2004

Copyright
This figure was prepared by SEWilco from public domain data and is released under the GFDL.

|
Разрешается копировать, распространять и/или изменять этот документ в соответствии с условиями GNU Free Documentation License версии 1.2 или более поздней, опубликованной Фондом свободного программного обеспечения, без неизменяемых разделов, без текстов, помещаемых на первой и последней обложке. Копия лицензии включена в раздел, озаглавленный GNU Free Documentation License. |
| Этот файл доступен по лицензии Creative Commons Attribution-Share Alike 3.0 Unported. | ||
| ||
| Этот признак лицензирования был добавлен к этому файлу как часть обновления лицензии GFDL. |
References
- Hansen, J., R. Ruedy, M. Sato, M. Imhoff, W. Lawrence, D. Easterling, T. Peterson, and T. Karl. "A closer look at United States and global surface temperature change". J. Geophys. Res 106: 23947-23963.
- Rayner, N. (2000) HadISST1 Seaice and sea surface temperature files. Hadley Center, Bracknell, U.K.
- Reynolds, R.W., N.A. Rayner, T.M. Smith, D.C. Stokes, and W. Wang (2002). "An improved in situ and satellite SST analysis for climate". J. Climate 15: 1609-1625. doi:10.1175/1520-0442(2002)015<1609:AIISAS>2.0.CO;2
История файла
Нажмите на дату/время, чтобы посмотреть файл, который был загружен в тот момент.
| Дата/время | Миниатюра | Размеры | Участник | Примечание | |
|---|---|---|---|---|---|
| текущий | 22:51, 17 декабря 2005 | | 758 × 492 (141 КБ) | Saperaud~commonswiki | *'''Description:''' [[en:Image:((subst:PAGENAME))]] |
Использование файла
Следующие 2 страницы используют этот файл:
Глобальное использование файла
Данный файл используется в следующих вики:
- Использование в be.wikipedia.org
- Использование в cs.wikipedia.org
- Использование в da.wikipedia.org
- Использование в de.wikipedia.org
- Использование в en.wikipedia.org
- Использование в eo.wikipedia.org
- Использование в es.wikipedia.org
- Использование в fi.wikipedia.org
- Использование в fr.wikipedia.org
- Использование в ha.wikipedia.org
- Использование в id.wikipedia.org
- Использование в it.wikipedia.org
- Использование в ja.wikipedia.org
- Использование в lt.wikipedia.org
- Использование в mk.wikipedia.org
- Использование в ms.wikipedia.org
- Использование в nn.wikipedia.org
- Использование в no.wikipedia.org
- Использование в pl.wikipedia.org
- Использование в pt.wikipedia.org
- Использование в ro.wikipedia.org
- Использование в simple.wikipedia.org
- Использование в sv.wikipedia.org
- Использование в tr.wikipedia.org
- Использование в uk.wikipedia.org
- Использование в vi.wikipedia.org
- Использование в www.wikidata.org
- Использование в zh.wikipedia.org
Text is available under the CC BY-SA 4.0 license; additional terms may apply.
Images, videos and audio are available under their respective licenses.
