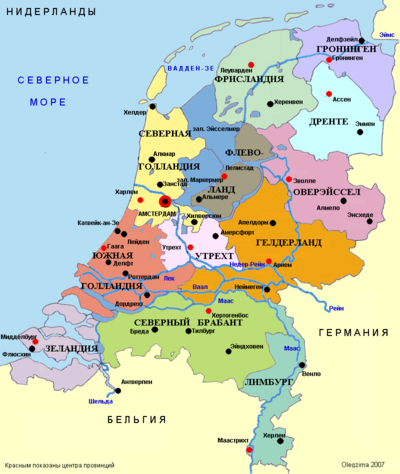
Продолжительность жизни в провинциях Нидерландов
Материал из Википедии — свободной энциклопедии
Евростат (2019—2022)
[править | править код]Разбиение Нидерландов на территориальные единицы 2-го уровня (NUTS 2) совпадает с делением страны на провинции. По умолчанию список отсортирован по 2022 году.

| код | регион[англ.] | 2019 | 2019 →2021 |
2021 | 2021 →2022 |
2022 | 2019 →2022 | ||||||
|---|---|---|---|---|---|---|---|---|---|---|---|---|---|
| общая | муж | жен | жен Δ муж |
общая | общая | муж | жен | жен Δ муж | |||||
| NL31 | У́трехт | 82,7 | 81,3 | 84,0 | 2,7 | −0,7 | 82,0 | 0,1 | 82,1 | 80,8 | 83,4 | 2,6 | −0,6 |
| NL34 | Зела́ндия | 82,6 | 80,8 | 84,4 | 3,6 | −1,3 | 81,3 | 0,7 | 82,0 | 80,2 | 83,8 | 3,6 | −0,6 |
| NL32 | Северная Голландия | 82,4 | 80,8 | 83,9 | 3,1 | −0,8 | 81,6 | 0,2 | 81,8 | 80,4 | 83,2 | 2,8 | −0,6 |
| NL41 | Северный Браба́нт | 82,3 | 80,6 | 83,9 | 3,3 | −0,7 | 81,6 | 0,2 | 81,8 | 80,3 | 83,2 | 2,9 | −0,5 |
| NL23 | Фле́воланд | 82,4 | 80,9 | 83,9 | 3,0 | −1,3 | 81,1 | 0,6 | 81,7 | 80,3 | 83,2 | 2,9 | −0,7 |
| NL33 | Южная Голландия | 82,2 | 80,6 | 83,7 | 3,1 | −0,8 | 81,4 | 0,3 | 81,7 | 80,1 | 83,2 | 3,1 | −0,5 |
| NL42 | Ли́мбург | 81,8 | 80,1 | 83,5 | 3,4 | −1,1 | 80,7 | 1,0 | 81,7 | 80,0 | 83,3 | 3,3 | −0,1 |
| NL12 | Фрисла́ндия | 82,0 | 80,4 | 83,5 | 3,1 | −0,7 | 81,3 | 0,3 | 81,6 | 80,3 | 82,9 | 2,6 | −0,4 |
| NL22 | Ге́лдерланд | 82,1 | 80,7 | 83,3 | 2,6 | −0,7 | 81,4 | 0,2 | 81,6 | 80,3 | 82,8 | 2,5 | −0,5 |
| NL21 | Оверэ́йссел | 81,9 | 80,4 | 83,4 | 3,0 | −0,8 | 81,1 | 0,3 | 81,4 | 79,9 | 82,9 | 3,0 | −0,5 |
| NL11 | Гро́нинген | 81,3 | 79,4 | 83,1 | 3,7 | −0,5 | 80,8 | 0,1 | 80,9 | 79,2 | 82,6 | 3,4 | −0,4 |
| NL13 | Дре́нте | 81,9 | 80,3 | 83,5 | 3,2 | −0,9 | 81,0 | −0,2 | 80,8 | 79,3 | 82,3 | 3,0 | −1,1 |
Источник данных: Евростат[1][2]
Графики и диаграммы
[править | править код]-
Изменение продолжительности жизни в Нидерландах согласно оценке Группы Всемирного банка[3]
-
Вариант графика с подсчитанной разницей в продолжительности жизни женщин и мужчин[3]
-
Изменение продолжительности жизни согласно оценке "Our World in Data"[4]
-
Изменение продолжительности жизни в Нидерландах в сравнении с некоторыми другими европейскими странами[3]
-
Ожидаемая продолжительность жизни и здоровой жизни в Нидерландах на фоне стран Европы в 2019[5]
-
Ожидаемая продолжительность жизни для мужчин и женщин по отдельности[5]
См. также
[править | править код]- Список стран по ожидаемой продолжительности жизни
- Список стран Европы по ожидаемой продолжительности жизни
- Административное деление Нидерландов
- Население Нидерландов
Примечания
[править | править код]- ↑ 1 2 Life expectancy at birth by sex and NUTS 2 region (англ.). Евростат (14 марта 2024). — Набор данных. Дата обращения: 28 марта 2024.
- ↑ 1 2 Life expectancy at birth by sex and NUTS 2 region (англ.). Евростат (14 марта 2024). — Таблица, для просмотра карты используйте на сайте вкладку Map. Дата обращения: 28 марта 2024.
- ↑ 1 2 3 Life expectancy at birth, total - Netherlands (англ.). Группа Всемирного банка.
- ↑ Life expectancy at birth: Netherlands (англ.). Our World in Data.
- ↑ 1 2 Life expectancy and Healthy life expectancy, data by country (англ.). Всемирная организация здравоохранения (2020). Дата обращения: 19 января 2024.
Нидерланды в темах | |
|---|---|
| Политика | |
| Символы | |
| Экономика |
|
| География | |
| Культура | |
| Религия | |
| Связь | |
| Старение |
| ||||
|---|---|---|---|---|---|
| Продление жизни |
| ||||
| Списки ОПЖ |
| ||||
| Рекорды |
| ||||
| Бессмертие | |||||
| Гены долголетия | |||||
| См. также | |||||
Text is available under the CC BY-SA 4.0 license; additional terms may apply.
Images, videos and audio are available under their respective licenses.


![Изменение продолжительности жизни в Нидерландах согласно оценке Группы Всемирного банка[3]](https://upload.wikimedia.org/wikipedia/commons/thumb/1/1b/Life_expectancy_by_WBG_-Netherlands_-ru.png/431px-Life_expectancy_by_WBG_-Netherlands_-ru.png)
![Вариант графика с подсчитанной разницей в продолжительности жизни женщин и мужчин[3]](https://upload.wikimedia.org/wikipedia/commons/thumb/f/f6/Life_expectancy_by_WBG_-Netherlands_-diff_-ru.png/360px-Life_expectancy_by_WBG_-Netherlands_-diff_-ru.png)
![Изменение продолжительности жизни согласно оценке "Our World in Data"[4]](https://upload.wikimedia.org/wikipedia/commons/thumb/a/ae/Life_expectancy_in_the_Netherlands.svg/319px-Life_expectancy_in_the_Netherlands.svg.png)
![Изменение продолжительности жизни в Нидерландах в сравнении с некоторыми другими европейскими странами[3]](https://upload.wikimedia.org/wikipedia/commons/thumb/b/b7/Life_expectancy_in_some_European_countries_-ru.png/355px-Life_expectancy_in_some_European_countries_-ru.png)
![Ожидаемая продолжительность жизни и здоровой жизни в Нидерландах на фоне стран Европы в 2019[5]](https://upload.wikimedia.org/wikipedia/commons/thumb/2/2d/Healthy_life_expectancy_bar_chart_-Europe_-ru.png/524px-Healthy_life_expectancy_bar_chart_-Europe_-ru.png)
![Ожидаемая продолжительность жизни для мужчин и женщин по отдельности[5]](https://upload.wikimedia.org/wikipedia/commons/thumb/f/f1/Healthy_life_expectancy_bar_chart_-Europe_-sex_-ru.png/524px-Healthy_life_expectancy_bar_chart_-Europe_-sex_-ru.png)
