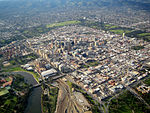
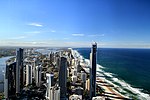
Daftar kota di Australia menurut populasi

ini hanyalah Daftar kota-kota besar di Australia . Kota-kota yang terdaftar diberikan peringkat dari yang paling besar ke yang paling kecil. Kota-kota diberikan peringkat berdasarkan wilayah statistik Ibukota (tidak termasuk Canberra) .
Terbesar dalam statistik Ibukota daerah/perkotaan
[sunting | sunting sumber]| Rank | GCCSA/SUA | State/Territory | June 2018[1] | 2011 Census[2] Population | Growth | Percentage of
national population (June 2018) |
|---|---|---|---|---|---|---|
| 1 | Sydney | New South Wales | 5,230,330 | 4.391.674 | +19.10% | 20.93% |
| 2 | Melbourne | Victoria | 4,936,349 | 3.999.982 | +24.08% | 19.86% |
| 3 | Brisbane | Queensland | 2,462,637 | 2.065.996 | +19.20% | 9.85% |
| 4 | Perth | Western Australia | 2,059,484 | 1.728.867 | +19.12% | 8.24% |
| 5 | Adelaide | South Australia | 1,345,777 | 1.262.940 | +6.56% | 5.38% |
| 6 | Gold Coast–Tweed Heads | Queensland/New South Wales | 679,127 | 557.822 | +21.75% | 2.72% |
| 7 | Newcastle–Maitland | New South Wales | 486,704 | 398.770 | +22.05% | 1.95% |
| 8 | Canberra–Queanbeyan | Australian Capital Territory/New South Wales | 457,563 | 391.645 | +16.83% | 1.83% |
| 9 | Sunshine Coast | Queensland | 333,436 | 270.770 | +23.14% | 1.33% |
| 10 | Wollongong | New South Wales | 302,739 | 268.944 | +12.57% | 1.21% |
| 11 | Geelong | Victoria | 268,277 | 173.454 | +54.67% | 1.07% |
| 12 | Hobart | Tasmania | 232,606 | 211,656 | +9.90% | 0.93% |
| 13 | Townsville | Queensland | 180,820 | 162.292 | +11.42% | 0.72% |
| 14 | Cairns | Queensland | 152,729 | 133.911 | +14.05% | 0.61% |
| 15 | Darwin | Northern Territory | 148,564 | 120.586 | +23.20% | 0.59% |
| 16 | Toowoomba | Queensland | 136,861 | 105.984 | +29.13% | 0.55% |
| 17 | Ballarat | Victoria | 105,471 | 91.801 | +14.89% | 0.42% |
| 18 | Bendigo | Victoria | 99,122 | 86.079 | +15.15% | 0.40% |
| 19 | Albury–Wodonga | New South Wales/Victoria | 93,603 | 82.083 | +14.03% | 0.37% |
| 20 | Launceston | Tasmania | 87,382 | 82.220 | +6.21% | 0.35% |
| 21 | Mackay | Queensland | 80,148 | 77.293 | +3.69% | 0.32% |
| 22 | Rockhampton | Queensland | 78,592 | 73.681 | +6.67% | 0.31% |
| 23 | Bunbury | Western Australia | 74,363 | 65.608 | +13.34% | 0.30% |
| 24 | Coffs Harbour | New South Wales | 71,822 | 64.243 | +11.80% | 0.29% |
| 25 | Bundaberg | Queensland | 70,921 | 67.341 | +5.32% | 0.28% |
| 26 | Wagga Wagga | New South Wales | 56,442 | 52.042 | +8.45% | 0.23% |
| 27 | Hervey Bay | Queensland | 54,674 | 48.680 | +12.31% | 0.22% |
| 28 | Mildura–Wentworth | Victoria/New South Wales | 51,903 | 47.536 | +9.19% | 0.21% |
| 29 | Shepparton–Mooroopna | Victoria | 51,631 | 46.505 | +11.02% | 0.21% |
| 30 | Port Macquarie | New South Wales | 47,973 | 41.723 | +14.98% | 0.19% |
| 31 | Gladstone–Tannum Sands | Queensland | 45,130 | 41.966 | +7.54% | 0.18% |
| 32 | Tamworth | New South Wales | 42,872 | 38.735 | +10.68% | 0.17% |
| 33 | Traralgon–Morwell | Victoria | 41,984 | 39.705 | +5.74% | 0.17% |
| 34 | Orange | New South Wales | 40,493 | 36.468 | +11.04% | 0.16% |
| 35 | Bowral–Mittagong | New South Wales | 39,887 | 34.858 | +14.43% | 0.16% |
| 36 | Busselton | Western Australia | 38,921 | 30.286 | +28.51% | 0.16% |
| 37 | Dubbo | New South Wales | 38,392 | 33.997 | +12.93% | 0.15% |
| 38 | Warragul–Drouin | Victoria | 37,928 | 29.944 | +26.66% | 0.15% |
| 39 | Geraldton | Western Australia | 37,648 | 35.749 | +5.31% | 0.15% |
| 40 | Nowra–Bomaderry | New South Wales | 37,420 | 33.338 | +12.24% | 0.15% |
| 41 | Bathurst | New South Wales | 36,801 | 32.479 | +13.31% | 0.15% |
| 42 | Warrnambool | Victoria | 35,214 | 32.380 | +8.75% | 0.14% |
| 43 | Albany | Western Australia | 34,205 | 30.656 | +11.58% | 0.14% |
| 44 | Devonport | Tasmania | 30,297 | 29.051 | +4.29% | 0.12% |
| 45 | Kalgoorlie–Boulder | Western Australia | 29,849 | 30.842 | −3.22% | 0.12% |
| 46 | Mount Gambier | South Australia | 29,639 | 27.756 | +6.78% | 0.12% |
| 47 | Lismore | New South Wales | 28,720 | 28.285 | +1.54% | 0.11% |
| 48 | Nelson Bay | New South Wales | 28,051 | 25,074 | +11.87% | 0.11% |
| 49 | Maryborough | Queensland | 27,282 | 26,214 | +4.07% | 0.11% |
| 50 | Burnie–Wynyard | Tasmania | 27,174 | 26.869 | +1.147% | 0.11% |
| 51 | Alice Springs | Northern Territory | 26,534 | 25.186 | +5.35% | 0.11% |
| 52 | Victor Harbor–Goolwa | South Australia | 26,532 | 23.850 | +11.25% | 0.11% |
| 53 | Ballina | New South Wales | 26,381 | 23.509 | +12.22% | 0.11% |
| 54 | Taree | New South Wales | 26,381 | 25.421 | +3.78% | 0.11% |
| 55 | Morisset–Cooranbong | New South Wales | 25,309 | 21.774 | +16.23% | 0.10% |
| 56 | Armidale | New South Wales | 24,504 | 22.464 | +9.08% | 0.10% |
| 57 | Goulburn | New South Wales | 23,835 | 21.484 | +10.94% | 0.10% |
| 58 | Whyalla | South Australia | 21,742 | 21.991 | −1.13% | 0.09% |
| 59 | Gympie | Queensland | 21,599 | 19.510 | +10.71% | 0.09% |
| 60 | Echuca–Moama | Victoria | 21,242 | 19.309 | +10.01% | 0.08% |
| 61 | Forster–Tuncurry | New South Wales | 21,159 | 19.500 | +6.51% | 0.08% |
| 62 | Griffith | New South Wales | 20,251 | 17.900 | +13.13% | 0.08% |
| 63 | Wangaratta | Victoria | 19,318 | 17.686 | +9.23% | 0.08% |
| 64 | St Georges Basin–Sanctuary Point | New South Wales | 19,251 | 12.611 | +52.65% | 0.08% |
| 65 | Grafton | New South Wales | 19,078 | 18.359 | +3.92% | 0.08% |
| 66 | Yeppoon | Queensland | 19,003 | 16.372 | +16.07% | 0.08% |
| 67 | Murray Bridge | South Australia | 18,779 | 16.708 | +12.40% | 0.08% |
| 68 | Mount Isa | Queensland | 18,588 | 20.569 | −9.63% | 0.07% |
| 69 | Camden Haven | New South Wales | 17,835 | 15.741 | +13.30% | 0.07% |
| 70 | Broken Hill | New South Wales | 17,734 | 18.517 | −4.23% | 0.07% |
| 71 | Moe–Newborough | Victoria | 16,812 | 16.674 | +0.83% | 0.07% |
| 72 | Karratha | Western Australia | 16,708 | 16.476 | +1.41% | 0.07% |
| 73 | Horsham | Victoria | 16,514 | 15,894 | +3.90% | 0.07% |
| 74 | Batemans Bay | New South Wales | 16,485 | 15.733 | +4.78% | 0.07% |
| 75 | Singleton | New South Wales | 16,346 | 16.135 | +1.31% | 0.07% |
| 76 | Port Lincoln | South Australia | 16,326 | 15.221 | +7.26% | 0.07% |
| 77 | Ulladulla | New South Wales | 16,213 | 14.149 | +14.59% | 0.06% |
| 78 | Bairnsdale | Victoria | 15,411 | 13.243 | +16.37% | 0.06% |
| 79 | Warwick | Queensland | 15,380 | 14.607 | +5.29% | 0.06% |
| 80 | Kempsey | New South Wales | 15,309 | 14.494 | +5.62% | 0.06% |
| 81 | Sale | Victoria | 15,021 | 14.258 | +5.35% | 0.06% |
| 82 | Ulverstone | Tasmania | 14,490 | 14.109 | +2.70% | 0.06% |
| 83 | Broome | Western Australia | 14,445 | 12.766 | +13.15% | 0.06% |
| 84 | Port Hedland | Western Australia | 14,320 | 13.772 | +3.98% | 0.06% |
| 85 | Port Pirie | South Australia | 14,188 | 14.043 | +1.03% | 0.06% |
| 86 | Emerald | Queensland | 14,119 | 13.219 | +6.81% | 0.06% |
| 87 | Port Augusta | South Australia | 13,799 | 13.658 | +1.03% | 0.06% |
| 88 | Lithgow | New South Wales | 12,973 | 12.249 | +5.91% | 0.05% |
| 89 | Colac | Victoria | 12,547 | 11.778 | +6.53% | 0.05% |
| 90 | Mudgee | New South Wales | 12,410 | 10.483 | +18.38% | 0.05% |
| 91 | Muswellbrook | New South Wales | 12,364 | 11.791 | +4.86% | 0.05% |
| 92 | Esperance | Western Australia | 12,145 | 11.432 | +6.24% | 0.05% |
| 93 | Parkes | New South Wales | 11,224 | 10.941 | +2.59% | 0.04% |
| 94 | Swan Hill | Victoria | 11,103 | 10.430 | +6.45% | 0.04% |
| 95 | Portland | Victoria | 10,900 | 10.715 | +1.73% | 0.04% |
| 96 | Kingaroy | Queensland | 10,398 | 9.808 | +6.02% | 0.04% |
- ^ Statistics. "Main Features – Main Features". www.abs.gov.au (dalam bahasa Inggris). Australian Bureau of Statistics. Diakses tanggal 2018-04-16.
- ^ "3218.0 – Regional Population Growth, Australia, 2011". Australian Bureau of Statistics. Diakses tanggal 15 April 2018.
Text is available under the CC BY-SA 4.0 license; additional terms may apply.
Images, videos and audio are available under their respective licenses.


