User:Lalala666
Stock Indices
[edit]I went to [2] to grab the daily data for the index (get the .csv version). I then loaded it into Excel, where I grabbed the date and daily closings and put them in columns a and b in a new worksheet. I applied the formula "=YEAR(A2)+(MONTH(A2)-1)/12+(DAY(A2)-1)/365" to turn the date into a number that the SVGizer could work with. I then ran the macro:
   Sub deleteNA()
       Dim i As Integer
       For i = 10000 To 1 Step -1
           If (Sheet14.Cells(i, 2).Value Like "            na") Then
               Sheet14.Rows(i).EntireRow.Delete
           End If
       Next i
   End Sub
to get rid of days for which we do not have data (holidays I guess?). You need to tweak it so the sheet's right, and so that "i" covers all your data (this one won't for the DJIA). Then, I copied the decimalized date column, and pasted into a new column as values (right click on the column header, select "Paste special...", and click values). I pasted the closing data in the column after it. I then inserted a row above the top value, made the date whatever the last date was plus a tiny amount, and set the closing price to zero (this is because the graph is really a polygon, and it gets confused if you don't close it with zero--or at least it does in Inkscape.) I put the letter "M" in the row in the cell before of the first date, and "L" in every cell below it (some SVG thing, I dunno).
I then copied the data into a template (one of the previous indices I worked on). Using Firefox as my debugger (it renders about the same way as Wikipedia does), I scaled the data correctly on that second "<g..." line. I added/removed horizontal and vertical lines as necessary to make it pretty, and then changed the stroke width at the top of the file so that the lines were clear but not horrendously thick. I then went all the way to the bottom of the file and added labels for the axes (this is really tedious), and finally went back to the top and translated the whole thing (first <g...") until the borders were padded about the same. Done!
Pictures
[edit]- Gallery of indices (and my two comparison graphs!)
-

-

-

-
 S&P 500 linear
 -
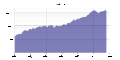 S&P 500 logarithmic
 -
 DJIA linear
 -
 DJIA logarithmic
 -
 Comparison of DJIA, NASDAQ Composite and S&P 500 after 1975
 -
![Comparison of DJIA, NASDAQ Composite and S&P 500. The Wikipedia SVG rasterizer wouldn't let me send up a prettier [1] graph with daily data :(](https://upload.wikimedia.org/wikipedia/commons/thumb/9/9f/Comparison_of_three_stock_indices.svg/120px-Comparison_of_three_stock_indices.svg.png) Comparison of DJIA, NASDAQ Composite and S&P 500. The Wikipedia SVG rasterizer wouldn't let me send up a prettier [1] graph with daily data :(
Comparison of DJIA, NASDAQ Composite and S&P 500. The Wikipedia SVG rasterizer wouldn't let me send up a prettier [1] graph with daily data :( - Gallery of crashes
-
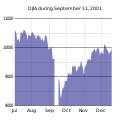 DJIA during 9/11.
 -
 DJIA on Black Monday (1987).
 -
 Dot com bubble illustration on the NASDAQ
 -
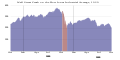 Wall Street Crash of 1929, with the October stock crash highlighted. Preludes the Great Depression.
 - Other graphs
-
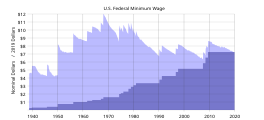 Federal minimum wage increases
 -

-
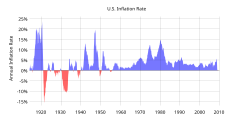 Historical inflation in the U.S.
 -
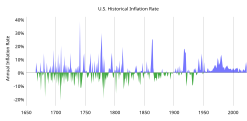 Historical inflation in the U.S.
 -
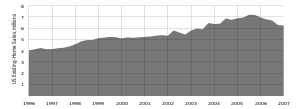 US existing-home sales (US housing bubble)
 -
-
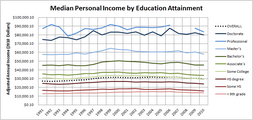 Graph of the history of education vs. income in the US


.svg)

![Comparison of DJIA, NASDAQ Composite and S&P 500. The Wikipedia SVG rasterizer wouldn't let me send up a prettier [1] graph with daily data :(](/en/File:Comparison_of_three_stock_indices.svg)


Graph test
[edit]| Graphs are unavailable due to technical issues. There is more info on Phabricator and on MediaWiki.org. |
| Graphs are unavailable due to technical issues. There is more info on Phabricator and on MediaWiki.org. |
| All workers | Full-time workers | |
|---|---|---|
| All | ||
| Men | ||
| Women |
- ^ "Table A-6: Earnings Summary Measures by Selected Characteristics: 2019 and 2020". www.census.gov. Retrieved 2022-04-26.
- ^ "Table A-6: Earnings Summary Measures by Selected Characteristics: 2019 and 2020". www.census.gov. Retrieved 2022-04-26.
Text is available under the CC BY-SA 4.0 license; additional terms may apply.
Images, videos and audio are available under their respective licenses.
