File:Hill Plot MWC model.png
No higher resolution available.
Hill_Plot_MWC_model.png (605 × 549 pixels, file size: 51 KB, MIME type: image/png)
| This is a file from the Wikimedia Commons. Information from its description page there is shown below. Commons is a freely licensed media file repository. You can help. |
Summary
| Description |
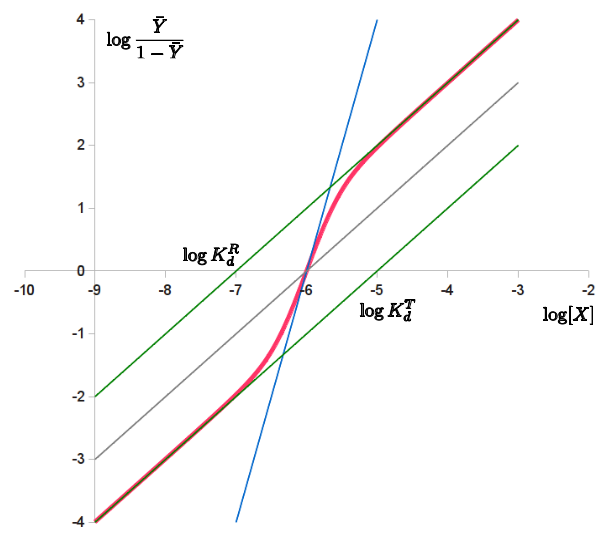
English: Hill plot of the Monod-Wyman-Changeux model, showing the changing slope of the binding function in red, indicating a Hill coefficient depending on saturation, and the intercepts of the green asymptots providing the dissociation constants of the R and T states. In blue is shown the corresponding Hill function and in grey the corresponding non-cooperative binding. |
| Date | |
| Source | Own work |
| Author | Lenov |
Licensing
I, the copyright holder of this work, hereby publish it under the following license:
This file is licensed under the Creative Commons Attribution 3.0 Unported license.
- You are free:
- to share – to copy, distribute and transmit the work
- to remix – to adapt the work
- Under the following conditions:
- attribution – You must give appropriate credit, provide a link to the license, and indicate if changes were made. You may do so in any reasonable manner, but not in any way that suggests the licensor endorses you or your use.
File history
Click on a date/time to view the file as it appeared at that time.
| Date/Time | Thumbnail | Dimensions | User | Comment | |
|---|---|---|---|---|---|
| current | 14:57, 17 December 2012 | | 605 × 549 (51 KB) | Lenov~commonswiki | Plot redrawn from computed values rathern than hand-drawn. The dissociation constants are now given by the intercepts with the x-axis, as it should be. |
| 15:08, 11 December 2012 |  | 398 × 350 (22 KB) | Lenov~commonswiki | User created page with UploadWizard |
File usage
The following pages on the English Wikipedia use this file (pages on other projects are not listed):
Global file usage
The following other wikis use this file:
Metadata
Text is available under the CC BY-SA 4.0 license; additional terms may apply.
Images, videos and audio are available under their respective licenses.
Cover photo is available under {{::mainImage.info.license.name || 'Unknown'}} license.
Cover photo is available under {{::mainImage.info.license.name || 'Unknown'}} license.
Credit:
(see original file).
