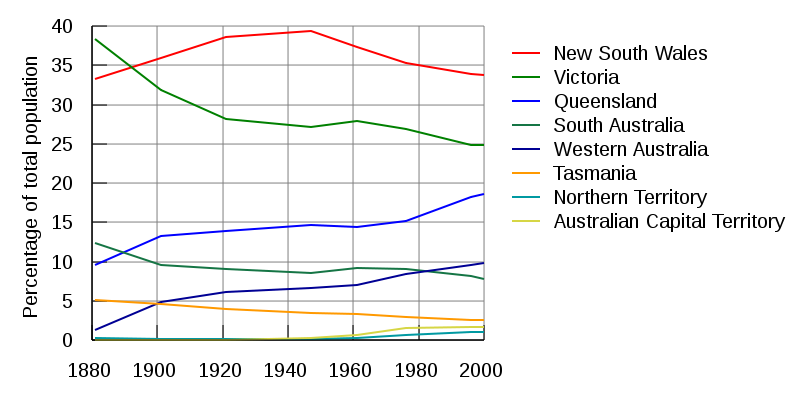
File:Australian population data as a percentage 1881-2000.svg

Original file (SVG file, nominally 800 × 400 pixels, file size: 12 KB)
| Description |
Graph of Australian population by territory with data points from 1881 through 2000. Source: I am the creator of this graph, and I release any and all copyright claims, releasing it into the public domain. This graph was created with gnuplot. My "commands" file contained: set terminal svg size 800 400 fname "Arial" fsize 20 enhanced set grid back lw 1 set border 3 set ytics nomirror set xtics nomirror set key outside Left reverse spacing 0.8 samplen 1 width -10 set ylabel "Percentage of total population" 0.6,0 set size ratio 0.8 # Skipping linetype (lt) 4; it's cyan and not very dark against white backgrounds. plot "data" using 1:2 with lines lw 2 lt 1 title "New South Wales", "data" using 1:3 with lines lw 2 lt 2 title "Victoria", "data" using 1:4 with lines lw 2 lt 3 title "Queensland", "data" using 1:5 with lines lw 2 lt 5 title "South Australia", "data" using 1:6 with lines lw 2 lt 6 title "Western Australia", "data" using 1:7 with lines lw 2 lt 7 title "Tasmania", "data" using 1:8 with lines lw 2 lt 8 title "Northern Territory", "data" using 1:9 with lines lw 2 lt 9 title "Australian Capital Territory" My "data" file contained: # http://findarticles.com/p/articles/mi_m0PCG/is_2002_Sept/ai_105657372/pg_1 # Changing patterns of population distribution in Australia # Journal of Population Research, Sept, 2002 by Graeme Hugo # p11 # # Table 1: Distribution of population between states and territories, 1881-2000 # #Territory New South Wales Victoria Queensland South Australia Western Australia Tasmania Northern Territory Australian Capital Territory 1881 33.3 38.3 9.5 12.3 1.3 5.1 0.2 0 1901 35.9 31.8 13.2 9.5 4.9 4.6 0.1 0 1921 38.6 28.2 13.9 9.1 6.1 3.9 0.1 0 1947 39.4 27.1 14.6 8.5 6.6 3.4 0.1 0.2 1961 37.3 27.9 14.4 9.2 7 3.3 0.2 0.6 1976 35.3 26.9 15.2 9.1 8.4 2.9 0.7 1.5 1996 33.9 24.9 18.2 8.1 9.6 2.6 1 1.7 2000 33.7 24.9 18.6 7.8 9.8 2.5 1 1.6 I generated the output with the command: gnuplot < commands > out.svg |
|---|---|
| Source |
Own work |
| Date |
17 June 2007 |
| Author |
Alan_De_Smet (talk) (Uploads) |
| Permission (Reusing this file) |
See below.
|
Summary
[edit]Graph of Australian population by territory with data points from 1881 through 2000.
Source: Hugo, Graeme (September 2002). "Table 1: Distribution of population between states and territories, 1881-2000". Changing patterns of population distribution in Australia in Journal of Population Research. p. 11. Retrieved 2007-06-17.
I am the creator of this graph, and I release any and all copyright claims, releasing it into the public domain.
This graph was created with gnuplot. My "commands" file contained:
set terminal svg size 800 400 fname "Arial" fsize 20 enhanced
set grid back lw 1
set border 3
set ytics nomirror
set xtics nomirror
set key outside Left reverse spacing 0.8 samplen 1 width -10
set ylabel "Percentage of total population" 0.6,0
set size ratio 0.8
# Skipping linetype (lt) 4; it's cyan and not very dark against white backgrounds.
plot "data" using 1:2 with lines lw 2 lt 1 title "New South Wales", "data" using 1:3 with lines lw 2 lt 2 title "Victoria", "data" using 1:4 with lines lw 2 lt 3 title "Queensland", "data" using 1:5 with lines lw 2 lt 5 title "South Australia", "data" using 1:6 with lines lw 2 lt 6 title "Western Australia", "data" using 1:7 with lines lw 2 lt 7 title "Tasmania", "data" using 1:8 with lines lw 2 lt 8 title "Northern Territory", "data" using 1:9 with lines lw 2 lt 9 title "Australian Capital Territory"
My "data" file contained:
# http://findarticles.com/p/articles/mi_m0PCG/is_2002_Sept/ai_105657372/pg_1
# Changing patterns of population distribution in Australia
# Journal of Population Research, Sept, 2002 by Graeme Hugo
# p11
#
# Table 1: Distribution of population between states and territories, 1881-2000
#
#Territory	New South Wales	Victoria	Queensland	South Australia	Western Australia	Tasmania	Northern Territory	Australian Capital Territory
1881	33.3	38.3	9.5	12.3	1.3	5.1	0.2	0
1901	35.9	31.8	13.2	9.5	4.9	4.6	0.1	0
1921	38.6	28.2	13.9	9.1	6.1	3.9	0.1	0
1947	39.4	27.1	14.6	8.5	6.6	3.4	0.1	0.2
1961	37.3	27.9	14.4	9.2	7	3.3	0.2	0.6
1976	35.3	26.9	15.2	9.1	8.4	2.9	0.7	1.5
1996	33.9	24.9	18.2	8.1	9.6	2.6	1	1.7
2000	33.7	24.9	18.6	7.8	9.8	2.5	1	1.6
I generated the output with the command:
gnuplot < commands > out.svg
Licensing
[edit]| I, the copyright holder of this work, hereby release it into the public domain. This applies worldwide. If this is not legally possible: |
↓ Attempt at transfer failed because of a non-standard DTD declaration (8 April 2023)
 | This file is a candidate to be copied to Wikimedia Commons.
Any user may perform this transfer; refer to Wikipedia:Moving files to Commons for details. If this file has problems with attribution, copyright, or is otherwise ineligible for Commons, then remove this tag and DO NOT transfer it; repeat violators may be blocked from editing. Other Instructions
| ||
| |||
File history
Click on a date/time to view the file as it appeared at that time.
| Date/Time | Thumbnail | Dimensions | User | Comment | |
|---|---|---|---|---|---|
| current | 16:51, 17 June 2007 |  | 800 × 400 (12 KB) | Alan De Smet (talk | contribs) | Graph of Australian population by terroritory with data points from 1881 through 2000. Source: ((cite web | url = http://findarticles.com/p/articles/mi_m0PCG/is_2002_Sept/ai_105657372/pg_1 | title = Table 1: Distribution of population between states and |
You cannot overwrite this file.
File usage
Metadata
Text is available under the CC BY-SA 4.0 license; additional terms may apply.
Images, videos and audio are available under their respective licenses.
